Let’s say you’re building your own house. You start by designing it - the style, the materials, the structure. By the time you get the actual building, you have a pretty good idea of how it’s going to look, how much time it’s going to take, and what it’s going to cost you. The same goes for a data collection project. Before you go out into the field, it’s important to reflect closely on what it is you want to achieve. Before you get to the actual analysis of your data, you should have a clear idea of what type of analysis you’ll be applying, why, and what information you expect to get out of it.
Without this prep work, you’ll simply be collecting bits of information that don’t necessarily provide the answers you need to achieve your project’s goals. Following the data journey methodology, you cover this in the design phase of your programme. However, it’s good practice to revisit these steps throughout your project to ensure you’re on track. Below, we’ve summarised the four key steps to analysing your data before you’ve captured it.
1. Identify your key questions
Asking the right questions in a clear and concise way can be the most challenging task in any data analysis project. The questions you ask should first of all stem from the problem, impact, and outcomes you have a identified in the design phase of your programme.
Let’s use an example. As more households make the transition to improved water sources, lower income households that aren’t able to make the transition face increased risk of contamination, particularly from faecal matter. Studies show that this increased risk is accompanied by poor sanitation levels. This project therefore wants to know the status of sanitation in X regions of [country] in order to improve WASH for all citizens. Thus, a data collection project is commissioned with the following objectives:
- Discover the relationship between income and water and sanitation levels of households per division and district.
- Predict which households are most likely to be vulnerable to water related diseases.
Questions can now be defined based on these objectives. A common pitfall is that the questions asked are not clearly defined or translated into data analytics concepts. To do this, you need to think about the specific type of information that is required to answer the question and therefore achieve the objective. When translating questions into data analytics concepts, the type of objective will most often dictate the type of data, preparation and modelling techniques used. For example, a prediction goal has very different implications than a descriptive goal, and inferring correlation requires fewer restrictions than inferring causal relations. All of these concepts are described in detail in our eBook: Understand your data and extract the insights that matter.
2. Conduct desk research to see whether data exists
Once you’ve clarified the questions that you need to ask and the data that you need to answer them, the next step is to see whether secondary data is available. Secondary data is existing data from external sources, as opposed to primary data, which is data that you collect yourself by conducting a survey. In practice, it’s rare for an existing dataset to deliver exactly what you are looking for, but secondary data can be useful for a number of reasons. Besides saving resources on collecting data that already exists, it can be used to:
- Triangulate data: This is a method of data validation whereby you cross verify your findings using data from other sources.
- Add layers to your data: For example, you can add population data to your data on water points in order to add context to your data.
- Generate ideas about the design of your survey: Secondary data can be used to inspire and inform your own survey design.
- Set a baseline for your data collection: For example, if water point or WASH data has already been collected for a particular region, you can use that as a baseline for your own data collection.
Open data portals are a fantastic resource for those looking to find secondary data for their programmes. At Open Data Inception, you can find over 2,600 open data portals worldwide.
One disadvantage of secondary data is that it isn’t always clear how the data was collected. If the sample strategy isn’t clearly documented, for example, then you can’t know whether the data is representative. For a thorough guide on how to conduct data research, check out this blog: How to conduct data research in four steps.
3. Choose the right data type
The next step is to consider the data types you’re going to work with and how you plan on deploying them in your project. The most common distinction is between structured and unstructured data. Most development projects use structured data, which can be subdivided into categorical and numerical data (see image below). The type of data you work with will determine the type of data analytics you apply.
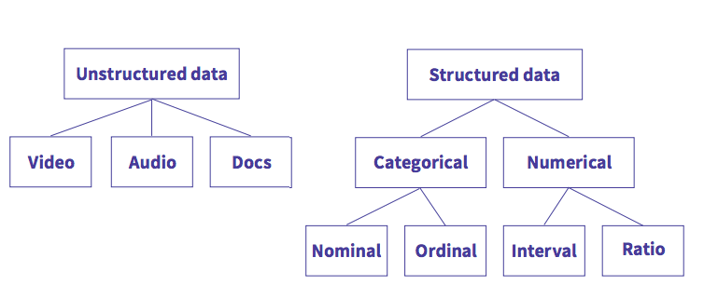
Categorical data: categorical data describes categories or groups
Nominal data
A nominal scale describes a variable with categories that do not have a natural order or ranking. Examples of nominal variables include gender, zip code, eye colour, race and political party.
Ordinal data
An ordinal scale is one where the order matters, but not the difference between values. Examples of ordinal variables include socioeconomic status (low income, middle income, high income), education level (primary school, high school, BS, MS, PhD), income level (less than 50K, 50K-100K, over 100K) or distance to the water source (<50, 100-200, 200+).
Numerical data: numerical data represents numbers
Interval data
An interval scale is one where there is order and the difference between the two values is meaningful. Examples of interval variables include temperature, IQ, pH or any other water quality parameter.
Ratio data
A ratio variable has all the properties of an interval variable, but has a true zero. In other words, there can be no negative numerical value in ratio data. Examples of ratio variables include age, weight, height, income earned in a week, years of education, and number of children.
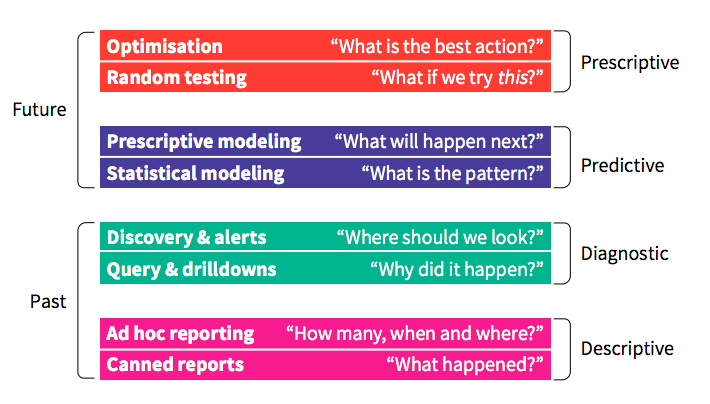
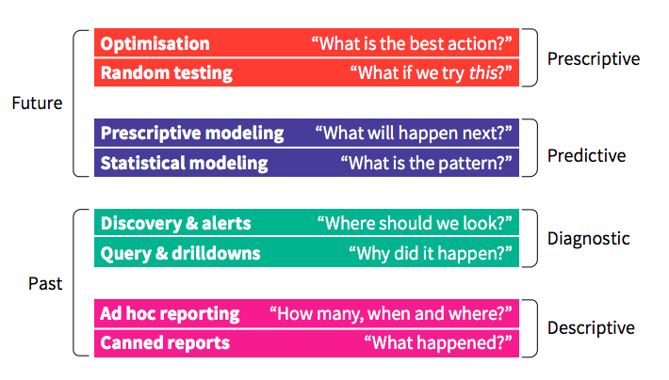
4. Decide which type of data analytics to apply
There are numerous ways to make sense out of data. The method you choose will depend on the questions you’re asking. When these questions are more about explaining what and why things have happened, descriptive and diagnostic analytics will come in handy. If the questions relate more to what could possibly happen in the future, predictive and prescriptive analytics are more appropriate. Below, you can see a visualisation of the different types of data analytics.
For more tips and tricks on analysing your data and translating it into powerful insights, download our eBook!
%20advert%20Data%20journey%20blog%20post.png?width=850&name=eBook3%20(Understand)%20advert%20Data%20journey%20blog%20post.png)