In 2017, Akvo received a grant from the Bill & Melinda Gates Foundation to look at creating a user-focused malaria data integration and visualisation system, which we wrote about here. We applied action research during two existing malaria data collection efforts, together with Australia-based Menzies (School of Health Research), and the Institute of Tropical Medicine (ITM) in Antwerp, Belgium. Both organisations work together on projects with the support of the Asia Pacific Malaria Elimination Network, APMEN. To eradicate malaria, researchers need to gather a lot of data on what drugs work best, and if people actually take the drugs they are prescribed. We’ve been working to improve the quality of data to ensure that important decisions are made based on the best available data.
Together with supervisors and enumerators, we defined data quality dashboards, which we implemented in Akvo Lumen. We also introduced Akvo Flow as a mobile data collection tool. After working with the setup, the general opinion was that it gave supervisors much more control over the quality of the data.
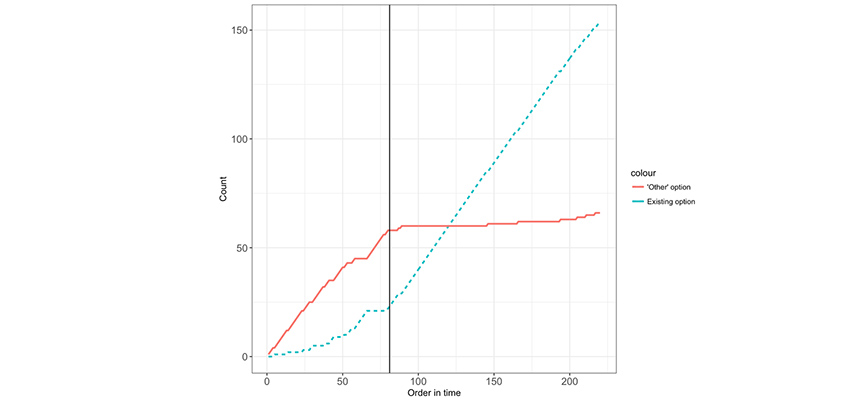
Above: The cumulative number of answers falling in the “other” category or in existing options as a function of the survey order in time. The vertical line indicates the moment new options were introduced.
This was particularly the case for surveys that were more anthropological in nature, as these have many questions that are localised. For example, the question “If you suspect malaria, where do you seek care?” would be followed by a list of possible options. However, the options can vary wildly per country or geographic region, so it is important to be able to look at the data as it comes in. By taking quick corrective action, the data quality can be improved a lot in cases where the options need to be adjusted significantly. The effect of this is shown in the figure, where we applied this idea to a particular option question that also had an “other” option. The figure shows the relative number times an existing option was chosen, versus the number that “other” was chosen.
A second interesting result (warning – might be a bit wonkish) was about unique identifiers. In the interest of privacy and data protection, it is considered good data collection practice to not collect personally identifiable information as part of medical data capture. Therefore, one of the most important pieces of information captured by an enumerator is usually a unique identifier. The unique identifier ties the captured information to other information, such as personally identifiable information or data collected at an earlier time. This makes the unique identifier a crucial piece of information – if it’s entered incorrectly, all the data captured in a survey can become meaningless. We found that in one particular study where enumerators had to select an identifier from a list, the error rate was about 1.3% – not large, but still an avoidable source of error. Interestingly, all the mistakes confused identifiers that were visually very similar, such as TRP-11-014C versus TRP-11-004C, and TRP-03-008 versus TRP-03-008C.
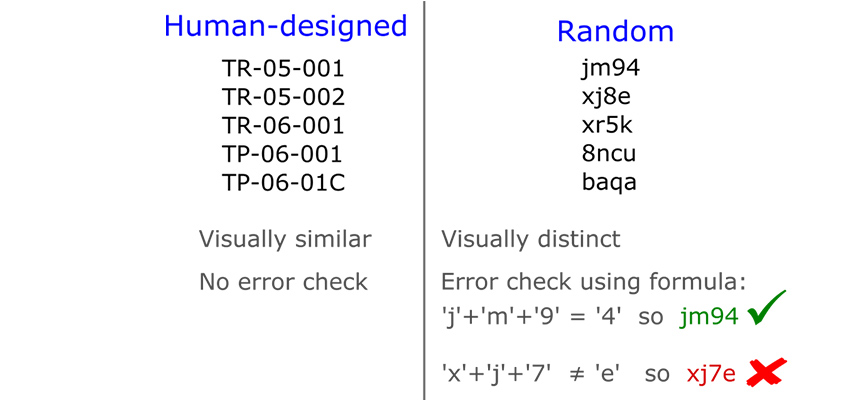
Above: Human designed versus random identifiers.
Human-designed identifiers such as these adhere to a logical structure, such as a pre-determined sequence of meaningful letters and numbers. The issue with this type of identifiers is that they can have a large visual similarity, which can easily lead to errors when selecting an identifier from a list. To avoid this type of error, we created a method which uses unique identifiers that are more random in nature, and for which the identifiers have a large visual distance from one another. One such option, which we describe in more detail in the report, is to use a fixed-length combination of random letters and digits, such as “a42y”, “gf7k”, or “bk2j”. They are not quite random – visually similar figures, such as “1” and “I” or “2” and “z” are removed, as they are easy to confuse.
This can be combined with a checksum character, whereby the last character of the identifier is a correctness check of the whole identifier, and is commonly used for credit card numbers and bank account numbers. This leads to identifiers with built-in quality control, and can therefore be hardened against wrong entry. It would even be possible for a mobile data collection tool to identify wrongly entered identifiers without the need of having a full list on the device. Let us know if you’re interested in using this, and we can share our method.
As part of the research, we produced two reports which can be downloaded below. The first report contains the results of our initial exploration of data management in the malaria sector. The second report contains the results of specific research we performed in Nepal, Vietnam and Indonesia. We hope the material is of use.
Contact us if you are interested in using this method to increase the quality of your data.
Report one: The Malaria data management landscape
Report two: Real-time data quality dashboards for improving malaria research data quality