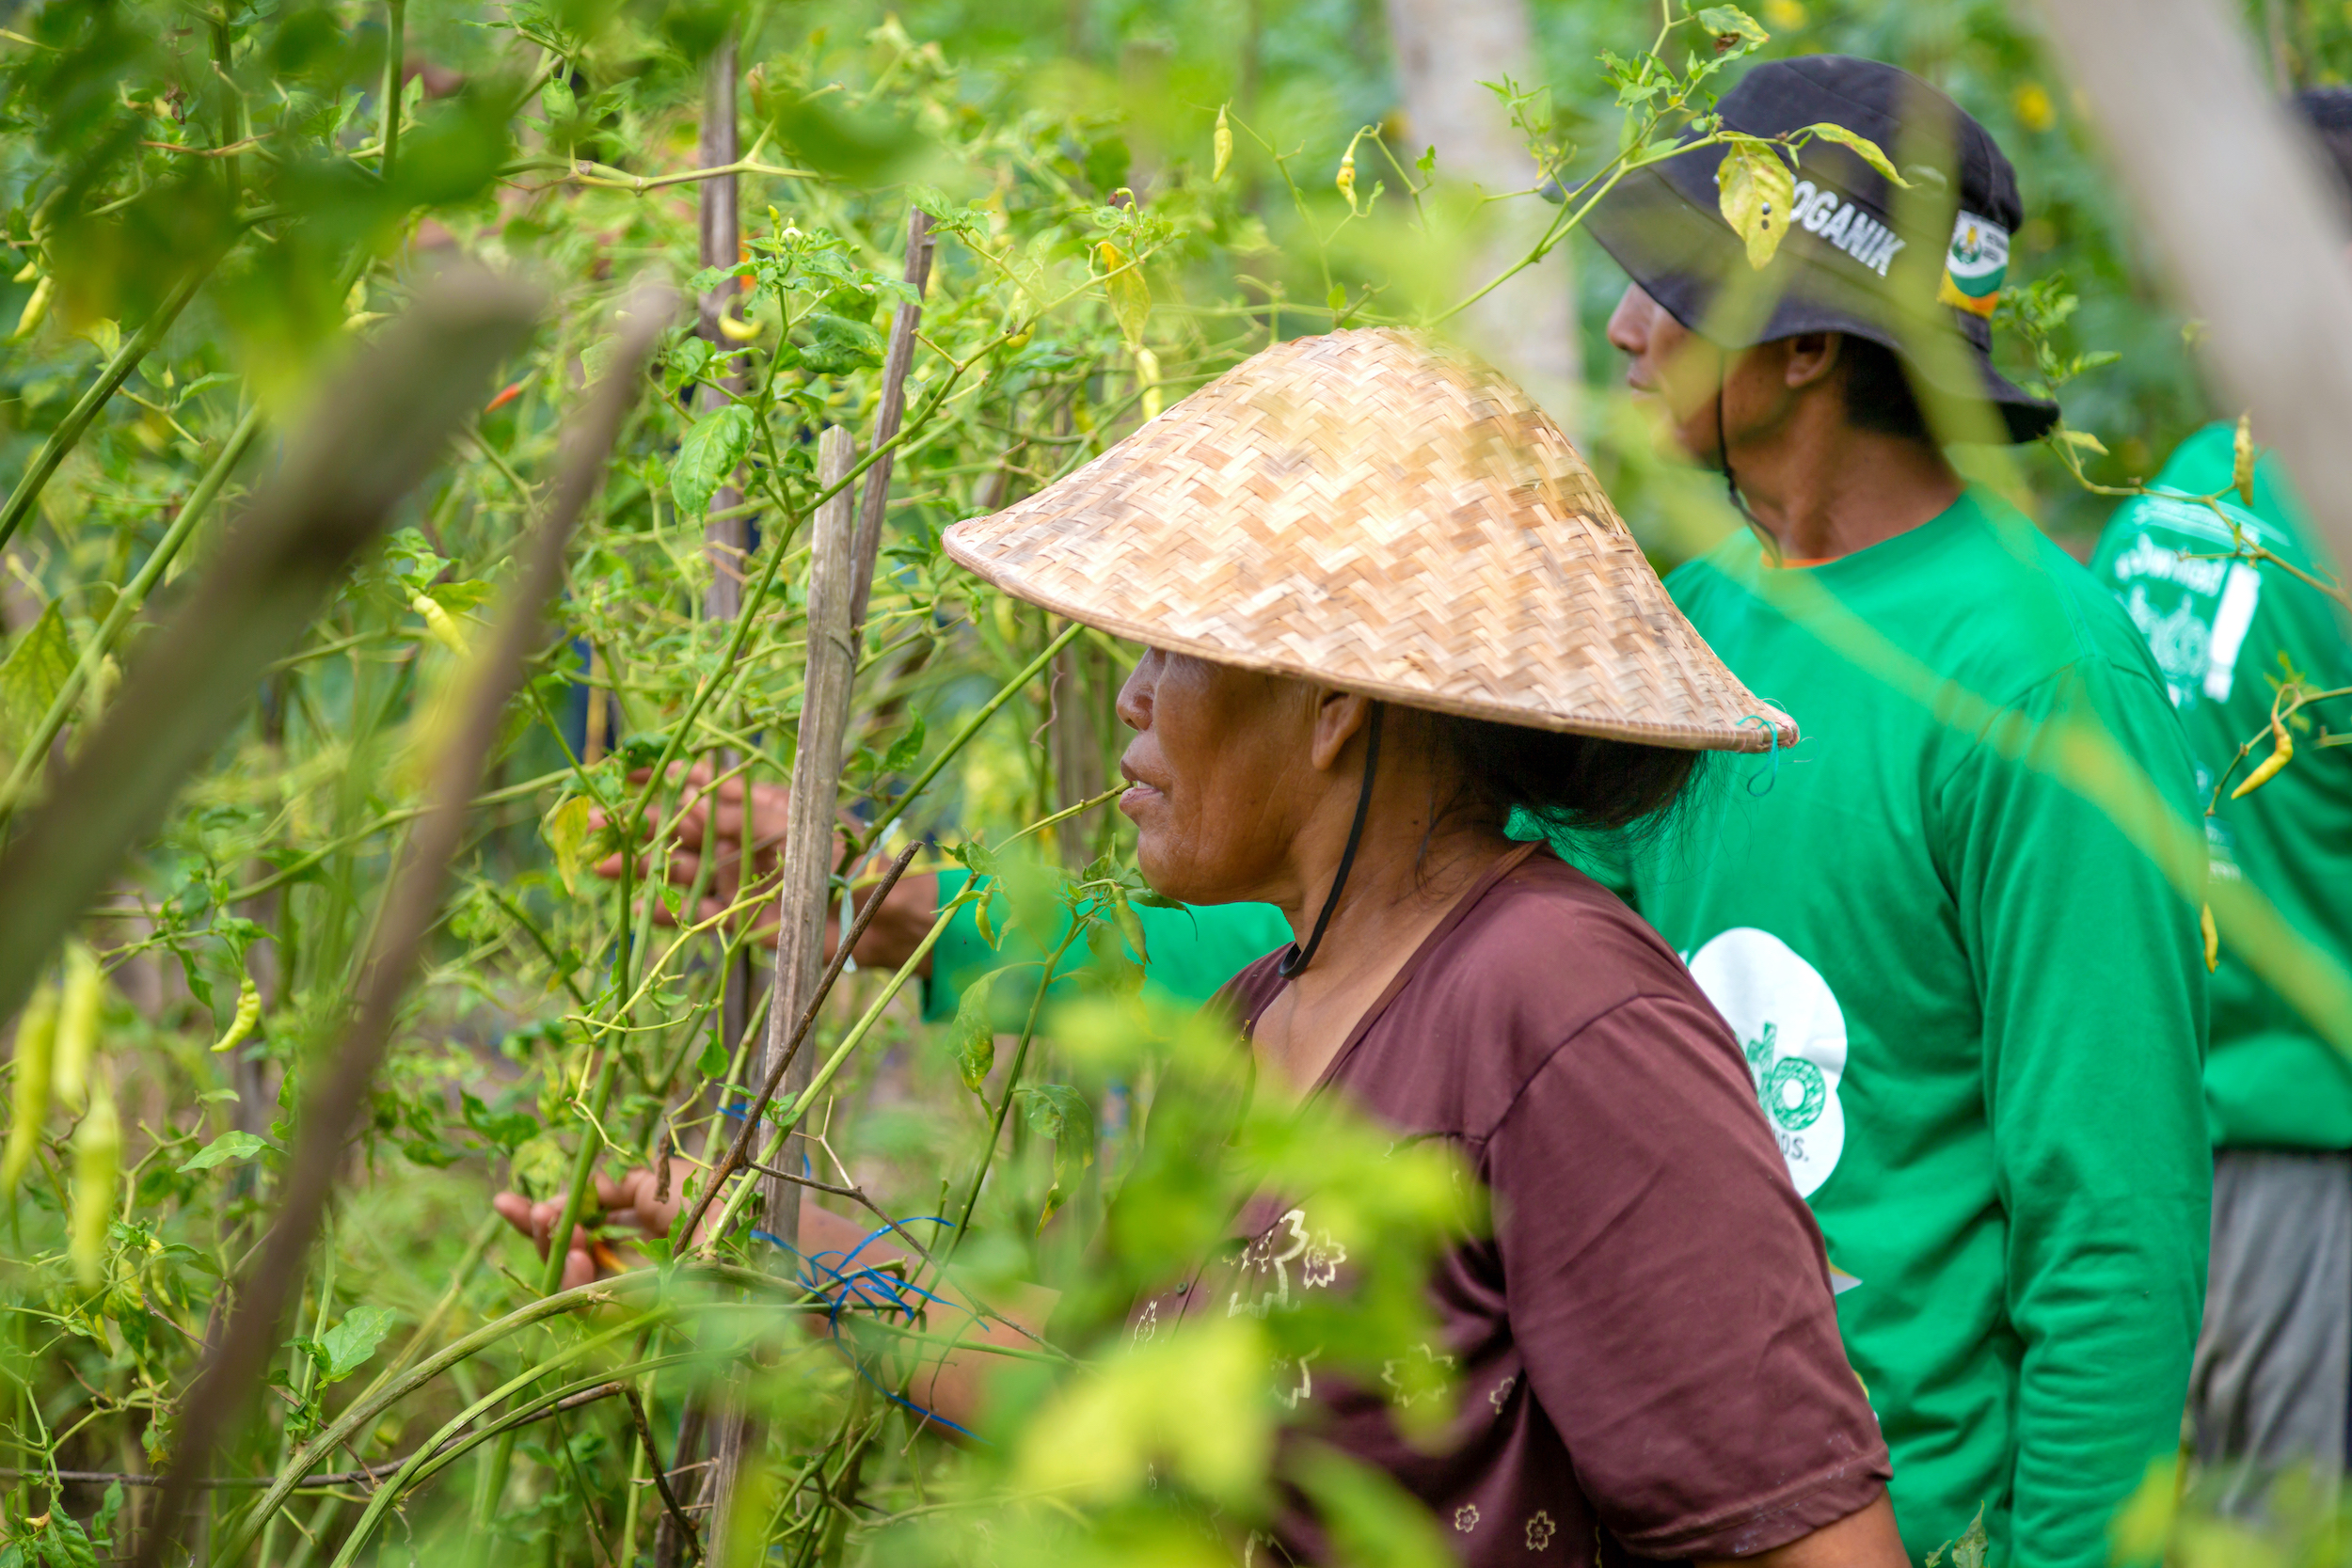
Smallholder farmers constitute 90% of all farmers in the world. Even though their plots of land are relatively small - less than two acres according to most definitions - they contribute substantially to global food chains. Many of these farmers live in impoverished conditions and are food insecure, making the global food supply unstable. Without the resources to invest in improving farming practices, these farmers have few opportunities to boost their livelihoods and ensure a secure food supply.
Organisations such as IDH have developed a business model in which value chain investors (usually the final buyer of a product) invest in local farmers to secure their supply. For example, rice value chain investors could stimulate mechanisation for rice farmers. Farmers could gain access to mechanisation equipment by making agreements with banks to provide loans, creating a low-threshold repayment schedule, as well as by establishing connections with equipment providers.
However, with approximately 513 million smallholder farms across the world, it remains a challenge to target as many of them as possible in a way that meets their specific needs. Furthermore, as a result of the complexity of farmer livelihoods, it is difficult to determine the needs of individual farmers. Farmer livelihoods are dependent upon many different factors, including household composition, household size, sources of income, land ownership, and access to loans. These all influence the effect of measures like training or inputs on productivity. Having access to reliable data is essential in being able to accurately depict the farmer’s situation and to group similar farmers together.
Here’s where data science can offer a helping hand.
Data science entails the use of analyses and algorithms to extract meaningful insights from data. With reliable data collection methods being established and the availability of reliable data increasing, the next step is to extract as much information as possible from this data. One specific data science technique that could be beneficial in this case is cluster analysis. This algorithm uses a similarity measure to determine which farmers are most similar to each other, and which farmers differ based on certain indicators. An example would be to group farmers based on input usage, which could create groups such as farmers using mostly compost, farmers using mostly fertiliser and pesticides, and farmers not using any inputs at all. In this way, data can be used to create groups (or clusters) of farmers that share some characteristics with farmers in the same group, but are different from farmers in another group.
These similarities and differences have the potential to inform about what each group of farmers would benefit most from. For example, one group might profit most from using more fertiliser, whereas another group might be mostly helped by adding another crop to their farmland, or receiving financial training. This would allow a targeted and scalable approach to improving smallholder farmer income, without the need to create a unique service package for each individual farmer.
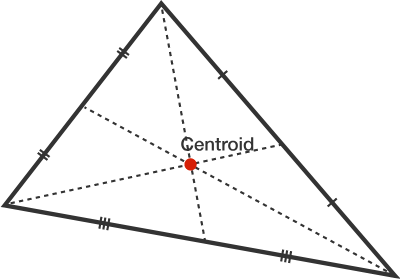
As an initial step towards this goal, Akvo conducted a cluster analysis on data from eight already completed case studies, including 2315 smallholder farmers from Kenya, Nigeria, and Tanzania. On average, these farmers possess 2.4 acres of farmland. An algorithm was used that computed the centroids of the clusters, which can be interpreted as representative points of the clusters that summarise information from all indicators, such as main crop income, use of seeds, and use of services. This concept is similar to finding the centroid of a triangle, but in this case, the number of sides is not three but 51 (equal to the number of indicators). Once optimal values of these centroids had been found, an optimal clustering was obtained. The algorithm outputs this optimal clustering as a number of clusters containing farmers that each share certain properties, and differ from farmers in the other clusters.
The current research found that crop type was an important factor in defining the clusters: each cluster contained almost exclusively farmers cultivating the same crop. This was no big surprise, given the fact that crop type influences to a large extent the amount of production, the income, and type of inputs and services the farmer benefits most from. Due to the heterogeneity of the data, the conclusions from this clustering are limited to general patterns such as a relation between main crop income and input costs - if main crop income increases, the amount of costs related to inputs increases as well. Specifically, it seemed that the use of herbicides increased when income increased.
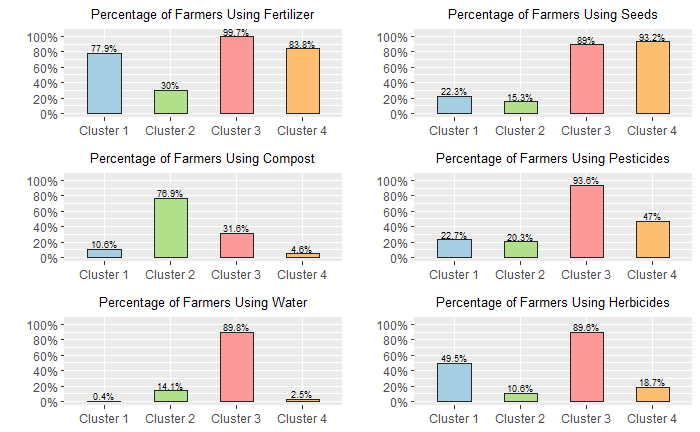
Above: These graphs show the share of farmers within each of the clusters using a certain input - fertiliser, seeds, compost, pesticides, water, and herbicides.
It would be interesting to see if such patterns existed within clusters. The amount of data in this case did not allow for a valid clustering within the obtained groups, but it was possible to inspect the clusters based on correlational analyses. Only in the third group did some similar patterns emerge: farmers with a higher income also tended to use more pesticides and spent more on fertiliser, herbicides, and seeds. Given the highly variable nature of the sample of farmers it would be premature to advise farmers to increase their use of these inputs in order to increase their income, but with more data for each of these groups of farmers, such hypotheses could be tested and monitored and have the potential to make a huge difference for both individual farmers and global food security.
Data science has the power to transform the livelihoods of smallholder farmers by targeting more farmers according to their specific needs. The availability of reliable data and the expertise to use this data are essential to this progress.
Are you curious to find out how data science could improve your programme? Get in touch.