

How do you make sure that the sample you use to gather your data is representative of the population you are researching? By taking the time to choose a sampling strategy. Choosing a sampling strategy is an essential step in the capture phase of the data journey and will ensure that your data is reliable and reflects the characteristics of your target group. In this blog, we'll take you step by step through the process by outlining the ways in which primary data is collected using an example in which a survey on characteristics (tax, education levels, etc) is collected on residents in five towns. The towns are of different sizes and have a total of 3,200 households. These 3,200 households make up the target population for your survey.
Step one: Define your sample and target population
At times, your survey may require you to cover the entire target population, as is the case in mapping or population studies. That’s usually referred to as a census survey. However, target populations are generally large and expensive to survey. In our example, it may not be feasible to visit all 3,200 households of the five towns. Instead, you’d want to choose a smaller sample that would be representative of the population and reflect its characteristics.
A survey that is done on a smaller number of the target population is referred to as a sample survey. You can infer your findings for the entire population based on this representative sample. In the following sections, we’ll describe the different terminologies that are associated with sample surveys, such as sample size and sampling technique. These concepts will enable you to determine the number of surveys needed to accurately reflect the true characteristics of a population and to choose the best method of selecting a sample from that population.
Step two: Define your sample size
The first step in your sampling exercise will be to decide on an appropriate sample size. There are no strict rules for selecting a sample size. You can make a decision based on the objectives of the project, time available, budget, and the necessary degree of precision.
In order to select the appropriate sample size, you will need to determine the degree of accuracy that you want to achieve. For this, you’ll need to establish the confidence interval and confidence level of your sample.
The confidence interval, also called the margin of error, is a plus or minus figure. It is the range within which the likelihood of a response occurs. The most commonly used confidence interval is +/- 5. If you wish to increase the precision level of your data, you would further reduce the error margin or confidence interval to a +/- 2. For example, if your survey question is “does the household pay tax?” and 65% of your sampled households say “yes,” then using a confidence interval of +/- 5, you can state with confidence that if you had asked the question to all 3,200 households, between 60% (i.e. 65-5) and 70% (i.e. 65+5) would have also responded “yes.”
The confidence level tells you how sure you want to be and is expressed as a percentage. It represents how often the responses from your selected sample reflect the responses of the total population. Thus, a 95% confidence level means you can be 95% certain. The lower the confidence level, the less certain you will be.
Most surveys use the 95% confidence level and a +/- 5 confidence interval. When you put the confidence level and the confidence interval together, you can say that you are 95% sure that, if you had surveyed all (3,200) households, between 60% and 70% of the households of the target population would have answered “yes,” to the question “does the household pay tax?”.
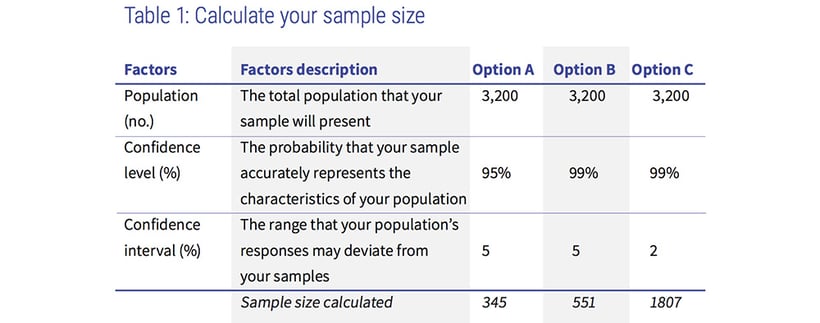
The size of your sample may be determined using any standard sample size calculator such as Survey Monkey or Raosoft. Using a standard sample size calculator (as can be seen in table one below) for our example of 3,200 households in five towns, we can examine the difference in sample sizes based on different confidence levels and intervals.
Option A
If you decide on a 5% confidence interval and want to achieve a 95% confidence level, the sample size will be 345 households.
Option B
If you wish to have higher accuracy and increase the confidence level to 99%, the recommended sample size would be 551.
Option C
For an even higher accuracy you could choose a 2% confidence interval and 99% confidence level and arrive at a sample size of 1807.
If time and resources permit, you could opt for larger samples and choose option C, to survey 1807 households. However, the quality of your findings are likely to only be marginally better than with option A or B, as the rate of improvement of accuracy gradually diminishes with the increase in sample size. The size of your sample should therefore be decided by the objectives of the study and resources available.
Step three: Define your sampling technique
Once you’ve chosen the sample size for your survey, you’ll need to define which sampling technique you’ll use to select your sample from the target population. The sampling technique that’s right for you depends on the nature and objectives of your project. Sampling techniques can be broadly divided into two types: random sampling and non-random sampling.
Random sampling
As the name suggests, random sampling literally means selection of the sample randomly from a population, without any specific conditions. This may be done by selecting the sample from a list, such as a directory, or physically at the location of the survey. If you want to ensure that a particular household does not get selected more than once, you can remove it from the list. This type of sampling is called simple random sampling without replacement. If you choose not to remove duplicate households from the list, you would do a simple random sampling with replacement.
Systematic sampling is the most commonly used method of random sampling, whereby you divide the total population by the sample size and arrive at a figure which becomes the sampling interval for selection. For example, if you need to choose 20 samples from a total population of 100, your sampling interval would be five. Systematic sampling works best when the population is homogeneous, i.e. most people share the same characteristics. In our example, the sampling interval would be nine (3200/345= 9 for a 95% confidence level and 5% confidence interval). You would thus select every ninth household in a town.
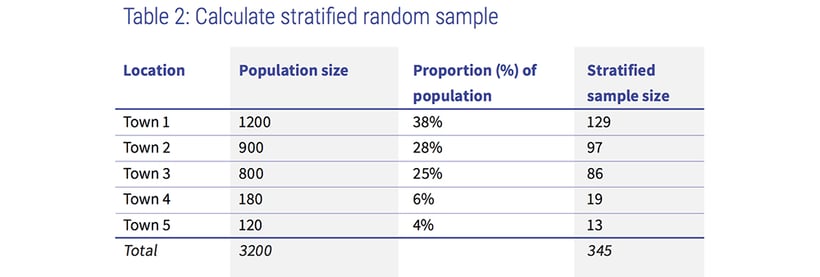
However, populations are generally mixed and heterogeneous. To ensure sufficient inclusion of all categories of the population, you will need to identify the different strata or characteristics and their actual representation (i.e. proportion) in the population. In such cases, you can use the stratified random sampling technique, whereby you first calculate the proportion of each strata within the population and then select the sample in the same proportion, randomly or systematically, from all the strata.
If we take our earlier example of five towns, to calculate a stratified random sample, you will need to calculate the proportion of each town within the sample size of 345 as shown in table two below. Column three gives the proportion of each town of the total population (3,200). In column four, the sample size (345) is proportionately divided across the five towns. For example, town three, which is 25% of the total population, will select 86 households with a sampling interval of nine (i.e. 800/86) in the same manner as was done for systematic sampling.
Non-random sampling
In non-random sampling, the sample selection follows a particular set of conditions and is generally used in studies where the sample needs to be collected based on a specific characteristic of the population. For example, you may need to select only households which own a car, or have children under six years of age. For this, you would consciously select only the 345 or 551 households that have those characteristics. Also termed purposive or subjective sampling, non-random sampling methods include convenience, judgment, quota and snowball sampling.
Step four: Minimise sampling error
It’s normal to make mistakes during sample selection. Your efforts should therefore always be to reduce the sampling error and make your chosen sample as representative of the population as possible. The robustness of your sample depends on how you minimise the sampling error. The extent of errors during sampling vary according to the technique or method you choose for sample selection.
For samples selected randomly from a target population, the results are generally prefixed with the +/- sampling error, which is the degree to which the sample differs from the population. If your study requires you to know the extent of sampling error that is acceptable for the survey, you can select a random sampling technique. In random sampling, you will be able to regulate the survey design to arrive at an acceptable level of error. In a non-random sample selection, the sampling error remains unknown.
Thus, when your sample survey needs to infer the proportion of a certain characteristics of the target population, you can select a random sampling method. But if you want to know the perceptions of residents regarding taxation laws or the school curriculum, you would want to capture as many perceptions as possible, and therefore select a non-random method in situations where sampling errors or sampling for proportionality are not of concern. Non-random sampling techniques can be very useful in situations when you need to reach a targeted sample with specified characteristics very quickly.
If you don’t have a sampling strategy in place, you may collect data which is biased or not representative, rendering your data invalid.
Do you want more tips on ensuring reliable data collection? Download our eBook!

.jpg)