However impressive you are in the kitchen, it’s unlikely that you’ll be able to pull off a fantastic meal with old or expired ingredients. The same goes for data - your analysis will only be as good as the data you use. If the data that goes in is garbage, the result of your analysis will also be garbage - this is sometimes referred to as GIGO (garbage in, garbage out). Data cleaning is the process of detecting and correcting (or removing) corrupt or inaccurate records from a record set, table, or database and refers to identifying incomplete, incorrect, inaccurate or irrelevant parts of the data and then replacing, modifying, or deleting the dirty or coarse data.
There are three key steps to data cleaning. In this chapter, we’ll walk you through the three steps, and then we’ll show you what happens when you analyse a dataset before you’ve cleaned it and after you’ve cleaned it, followed by some tips on how to minimise data cleaning.
1. Safely store your data
Before making any changes, make sure the original raw data is stored safely with a good backup strategy in place. For example, save the original dataset both locally and in a secure online storage space.
2. Tidy your dataset
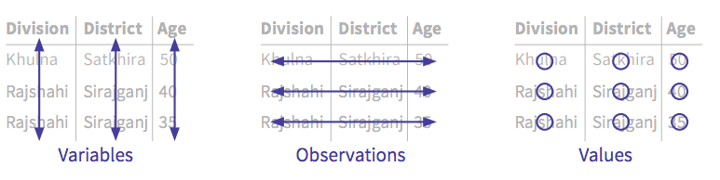
Tidy datasets are easy to manipulate, model and visualise, and have a specific structure:
- Each variable forms a column.
- Each observation forms a row.
- Each type of observational unit forms a table.
From here, we can start checking other things:
- Are all your columns are in the right data format, e.g. numbers as numerical and not as text?
- Does every column have a unique, correct and simple header? For example: “Age” instead of “What is your age?”
- Have you double checked the character encoding? When you import data from CSV for example, the character encoding can be wrong which can result in special characters not being displayed correctly, e.g. "Fédération" instead of "Fédération". UTF-8 encoding does well with most languages.
3. Clean your data
At this stage, you can start checking for inconsistencies and inaccuracies in your data using the table below as a guide. This table shows the key elements to data quality - accuracy, consistency, completeness, timeliness, uniqueness, and validity. Each of these elements should be checked for each and every variable as well as a combination of variables.
Accuracy
How close is the value of the data to the true value? In other words, how accurately does the value of the data describe the object or event being described? There are two types of accuracy.
Syntactic accuracy
In this case, the value might be correct, but it doesn’t belong to the correct domain of the variable. For example: A negative value for duration or age or a percentage higher than 100
Semantic accuracy
In this case, the value is in the correct domain, but it is not correct. For example: The attribute gender is given the value “female” for a person called John Smith.
Consistency
Do all the values of one variable represent the same definition? For example: Distance recorded in the same unit throughout the dataset.
Completeness
How complete is the dataset with respect to variable values and/or records?
Variable values: Are there values missing for certain variables?
Records: Is the dataset complete for the analysis at hand? For example, you set out to survey 1,000 households but only have 900 completed.
The occurrence of missing values can have different causes. People might have refused or forgotten to answer a question in a questionnaire, or a variable might not be applicable to a certain object. For instance, the variable “pregnant” with the two possible values, yes and no, does not make sense for men. Of course, one could always enter the value no for the attribute pregnant. But this might lead to a grouping of men with not-pregnant women.
Timeliness
How timely is the data? For example: Data has to be collected within a defined time period.
Uniqueness
Is there any duplicate data? Checking the uniqueness in a dataset consists of identifying and correcting duplicated rows (observations). For example: A waterpoint that has been mapped twice.
Validity
Does the data conform to the defined rules? For example: The project ID should always be three characters between A-Z. A value such as abdd is therefore invalid.
Handling outliers
Once you’ve checked your data against the data quality elements, you should also check for outliers. An outlier is a data point that differs significantly from other observations.
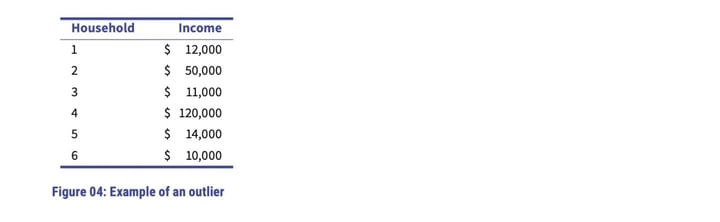
Here, you can see an example of an outlier. While most households have an income of between $10,000 and $50,000, household four has an income of $120,000. First, you should check with the data collector. Did they really earn this amount or was it a typo? If this isn't possible, you’ll have to make the decision yourself:
- If you are sure it is a typo, modify the value to $12,000.
- Leave the value (there might be a household that actually earns this) and maybe use mode instead of average to avoid getting a skewed view of the data.
- Replace the value by the mean of the variable.
- Remove the observation based on a statistical threshold, for example when a value is two standard deviations from the mean.
It can be time consuming to check for outliers manually, especially when there are many observations. A simple trick to speed this process up is to visualise the data with the use of a box plot.
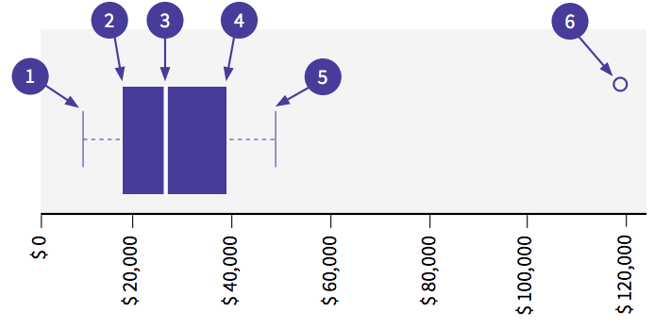
- The minimum (the smallest number in the dataset)
- First quartile (Q1)
- The median
- Third quartile (Q3)
- The maximum
- An outlier (this values lies outside of the maximum)
Here, we can see that there are values outside of the maximum which indicates that there is an outlier.
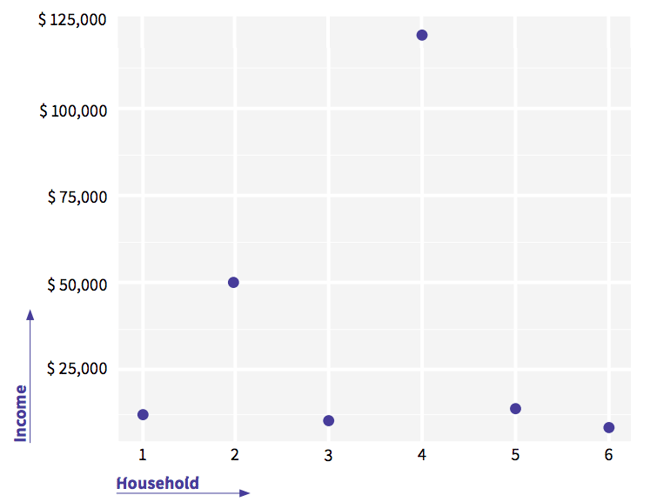
You can also use a scatter plot to identify outliers, as visualised below:
Data analysis before and after cleaning
Let’s see what happens when you analyse data before you’ve cleaned it. To show how best to approach data cleaning, analysis and visualisation, we'll use an example dataset which you can view here: Example WaSH dataset. The dataset contains information about WaSH facilities in households in Bangladesh, including data on the household, the water source, the toilet facilities, hand washing facilities, and geolocation.
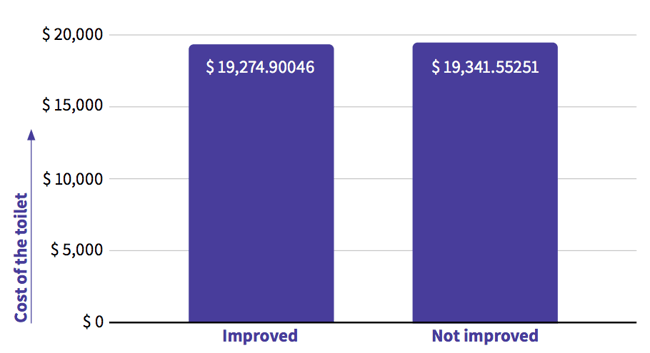
Using this dataset, we’ll perform the same analysis before and after cleaning. We want to know what the average cost of a toilet is per type. Based on data that has not yet been cleaned, we can see that an improved toilet costs on average $19,275. Here is an analysis conducted using unclean data:
In order to clean the data, we started by assessing the data quality indicators as described at the beginning of this chapter. In this project, the working group concluded that it is not possible to have a toilet that costs more than $50,000. We decided to investigate further by looking at other indicators. Most mobile data collection tools enable enumerators to add additional data during collection. For example, the geolocation (was it captured at the planned location?), the survey duration (did the interview take a realistic amount of time for the number of questions?) and, for example, a picture (do we see the expected subject?). In our example, the expected survey duration was between 30 and 45 minutes and our outlier was collected in just 11 minutes. Knowing that both the cost and time value were outside our limits, we decided to take the value out.
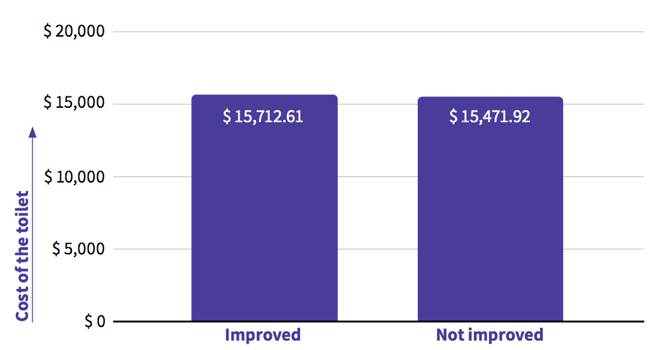
After cleaning the data and removing the outlier, we performed the same analysis, which is shown in the visualisation below. This time around, we see that an improved toilet costs on average $15,713, as shown in the visualisation below. This is more than a 20% difference with the uncleaned value. Using unclean data can therefore lead to bad decision making.
Minimising data cleaning
Data cleaning is time consuming. You can significantly minimise data cleaning by designing your survey with data quality in mind. One way to do this is by limiting the possible answers to a certain question without influencing the actual response. For example, when trying to discover the age of an interviewee, it’s advisable to choose a numeric question so that every answer is numeric (e.g. 6, 10, 60). You could leave it at this, but the data collector could mistakenly tap another zero when entering 60. Most data collection tools allow us to further limit the responses. For example, for a household interview you could say the age should be >18 and <116. It should be above 18 as you only want to interview adults and below 116 as this is the oldest living person in the world. For a deep dive into solid survey design, check out this blog: How to design your survey for smooth and reliable data collection.
Additional tips:
- If applicable, design a set of rules that can be checked during data collection to prevent mismatches of answers (If the answer to Q1 is A, then the answer to Q2 cannot be B).
- Train the enumerators thoroughly to optimise data quality during collection.
- Monitor incoming data during data collection and try to correct it as soon as possible, preferably while you still have access to the data collector and the interviewee.
- Keep a change log where you document all data cleaning actions.
For more tips on translating data into powerful insights, download our eBook!
%20advert%20Data%20journey%20blog%20post.png?width=850&name=eBook3%20(Understand)%20advert%20Data%20journey%20blog%20post.png)