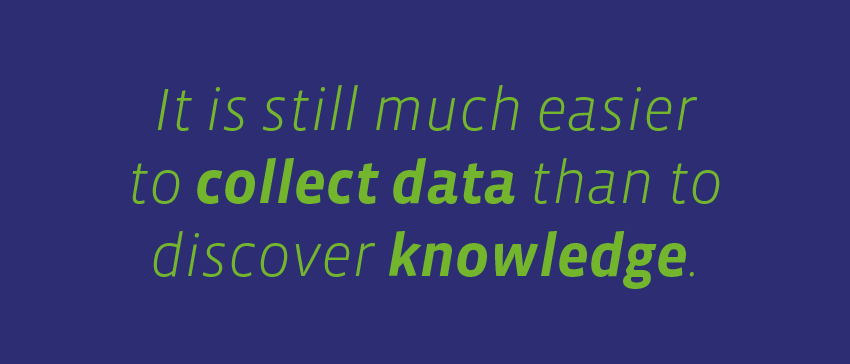
Above: One of my favorite quotes. Very actual in 2017! Graphic by @lindadutches.
For ten years, Akvo has been building up a portfolio of tools and services to help organisations in the international development and national governments to get better at capturing, understanding and sharing data in order to make better decisions and take better actions. So how do we use data science for decision making?
To date, we’ve helped hundreds of organisations and a dozen national governments to capture over four million data points and implement numerous programmes. Along all these years, and following up on multiple ventures with our partners, it became apparent that many organisations still struggle to make the most out of the data they collect. It is still much easier to collect data than to discover knowledge.
I joined Akvo just over nine months ago with one concrete aim: to set up the pillars of Akvo’s first data science team. Data Science will be a service that in combination with Akvo tools will help our partners make sense of their data, and act upon it. So far I’ve been connecting with a handful of partners both in water and sanitation and agriculture, exploring together how they can make better use of the datasets they’ve collected with Akvo Flow.
One example is ICCO, who we’ve been helping to investigate the causes of food insecurity in some regions of Bangladesh, Tanzania and India and also across Ethiopia. In parallel, we worked with WPDx to explore possibilities around predicting water point functionality and the best ways to communicate these data findings to national governments. Together with WASH Alliance International, we try to understand what drives people to adjust the behavioral change in their use of water and sanitation facilities. In the Watershed strategic partnership, we’ve been guiding participants on how to formulate the right questions and gather data from multiple online resources.
So what is data science?
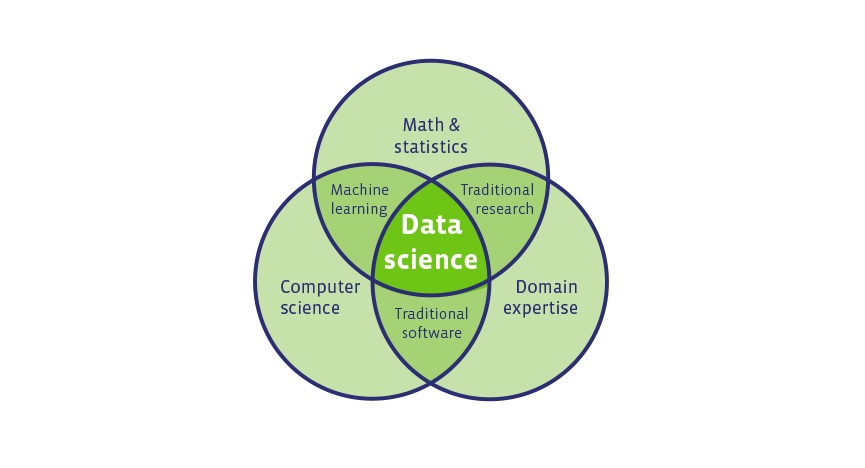
Data science is an interdisciplinary field about scientific methods to extract knowledge or insights from data in various forms, either structured or unstructured. At its core, data science is what happens at the intersection of three things: strong maths and statistics, computer science, and a strong domain knowledge, in our case, Water and Sanitation and Agriculture.
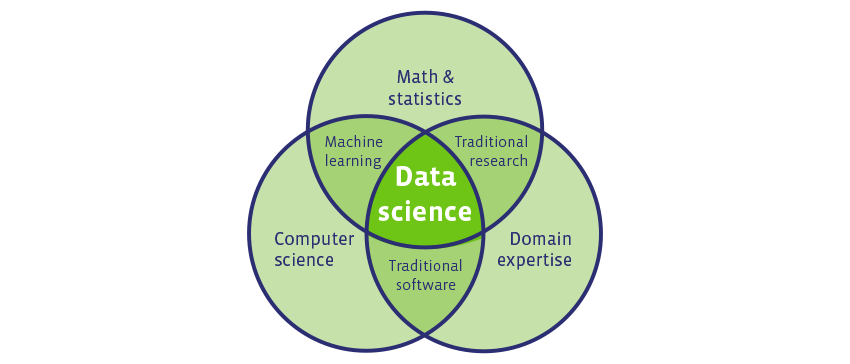
Above: Data Science is what happens at the intersection of strong maths and statistics, computer science, and a strong domain knowledge. Diagram @lindadutches.
You are trying to solve a problem. So what’s next?
In general, the data science process involves two big phases: preparation and execution. Within each phase, there are three main guiding steps to follow.
During the first phase, you mainly want to formulate your problem, gather the data to address it and prepare that data for the analysis. During the second phase, you’ll perform the actual analysis: summarise the information to understand your data better, find ‘hidden’ patterns and relationships, apply modeling and communicate your story to influence and make things change.
Phase 1: Preparation
Step 1. What problem are you trying to solve? Are your asking the right question(s)?
Before you start solving any problem, you should know and understand what the problem is. Get in love with the problem, not the solution, they say. As trivial as this may sound, asking the right question(s) is crucial to creating good insights from data. First, we have to understand -really well- what is it that our partners are struggling with and how they view the problem. Very often we will be looking to solve a big problem in many places at the same time. But the situation in, let’s say different countries can vary, for example trying to see what characteristics does a functioning water point may differ per country or even per region. We have to make sure that we make the problem we are trying to solve as specific as possible. Otherwise, we might be applying the wrong solution to the wrong problem.
Step 2. Which data sources are you planning to use/combine?
We now know what the problem is. But to arrive at a solution, we need data. Very often an organisation will already own part of this data, but we still might not find all the information we need to answer the question. So we need to look for external sources. There are a wealth of open data resources available, but linking different datasets can be complicated and requires careful consideration. It needs to be the right data. Say you want to connect household data on water and sanitation facilities with data about public spending on WASH. Both datasets are collected at different levels; household level and district, region and country. Can you connect the two, and if so, how do you do it? What are the challenges?
Step 3. Is your data clean and ready to be used?
One would think that once you get all the information you need you can just jump right in and start doing cool things, like visualisations and progressions. The truth is that no matter where you got your data from you will always need to clean it. Always. Data cleaning very often takes a big chunk of every data science project. When you clean data, you try to understand every single column in your dataset, identify the missing or corrupt values and make sure the data is consistent, for example, different spellings of the same thing. Think about the complexity of conducting a survey in three countries. You want to see differences between them. Unfortunately, although you supplied the same survey in each country, the spelling in each of the surveys is slightly different. As the manager of a water point, you will have “WASH committee”, “Wash committee”, “WaSH committee”, “wash committee”, “WASH comm” and so on. When you read this data even in Excel, all of those spellings will be treated as different types of manager but we know they, in fact, they are all the same. You need to correct that to make your data meaningful. Corrupt values are always a classic. Let’s say you ask for the age of the water point in years and you have a value of 999 for one point, 250 or 0 for some others. You have to think if this is a feasible value and if not, how are you going to treat it.
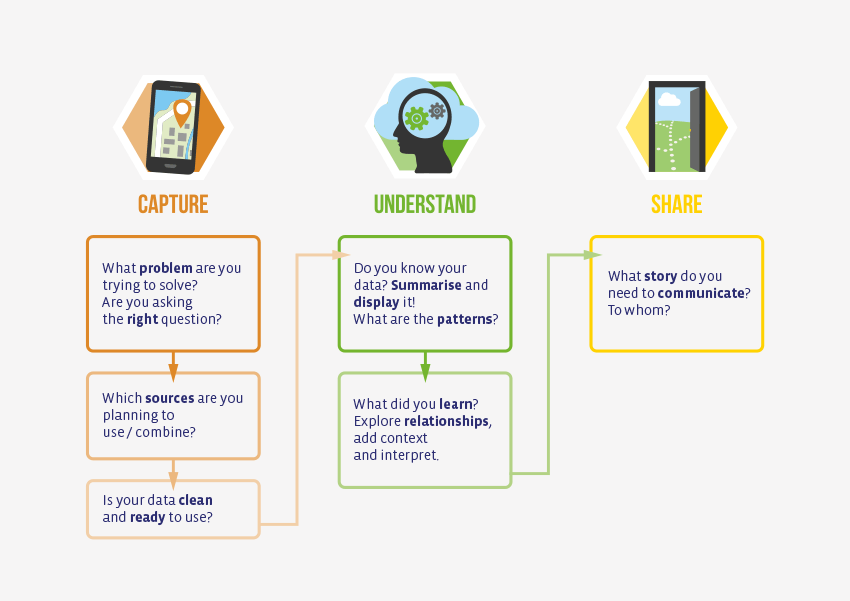
Above: A brief diagram of how we see the Data Science process and how it can help you. Diagram by @lindadutches.
Phase 2: Execution
Step 4. Do you know your data?
Data exploration is when we start to look at the data and see which parts will be significant for answering the question we have. You can spend a lot of time just looking at the data, but what you want is to quickly find the relevant patterns that will lead you to the answer you want to find. When you first look at the clean dataset you want to understand all the different variables you have. You want to see what depends on what and start finding the patterns in the dataset. If you are looking at the data about water points you want to see all the characteristics that make that water point functional and see if you can distinguish some patterns.
Step 5. Do you need to dig deeper?
Once you have a preliminary pattern identified, it’s time to go deeper. This is the really fun and exciting part of every data science project. Here we start leveraging all our mathematics, statistics and programming skills to tackle the problem. We might create a predictive model that will help us understand the issue and predict the future. Modeling and predicting are very valuable tools that help our partners to better distribute their resources. Once you found your patterns you can see what makes the water point work. Now you can use this knowledge to try and predict which water points are most vulnerable. This can be very useful in planning the repairs and budgeting for them.
Step 6. What do story you need to communicate? To whom? Why?
In order to make the whole data science process worthwhile, we need to communicate the insights we gained in a compelling and digestible way. There is no point in producing information that no one will understand. We need to create a story that combines the information we obtained with the domain knowledge of the organisation to answer the question we asked. Communicating the results of data analysis is the crucial point. However, it’s also very important how we communicate. If the message is not clear we risk that no action will be taken. We also have to make sure that the message we are communicating is clear and audience specific. If we make complicated graphics that require a lot of explanation to be comprehended we risk that our audience will not give it enough attention and our message will be lost.
Thinking about the two phases and the six steps may help you identify some problems and needs your organisation might be facing. It can also help you understand where your organisation is in the process of transitioning from data(capturing) to decision(making).
If you want to get more out of your data and are just not sure where to start, let us know. We are here to help you discover the full potential of what’s sitting in your datasets.